Blog 2
Introducing the AWS WAF Traffic Overview Dashboard
Hello everyone in the AWS Study Group VN community. Today, I want to share a highly useful update that makes network security operations much easier: the AWS WAF Traffic Overview Dashboard.
For network security engineers, protecting application uptime requires continuous monitoring of baseline traffic and investigating suspicious IP addresses. The challenge is scaling application protection without expanding the Security Operations Center (SOC) team. To address this operational challenge, AWS WAF has launched the traffic overview dashboard, enabling rapid and accurate decision-making.
Key Features of the Dashboard
The most significant benefit is that it is completely free and available by default—no manual setup is required.
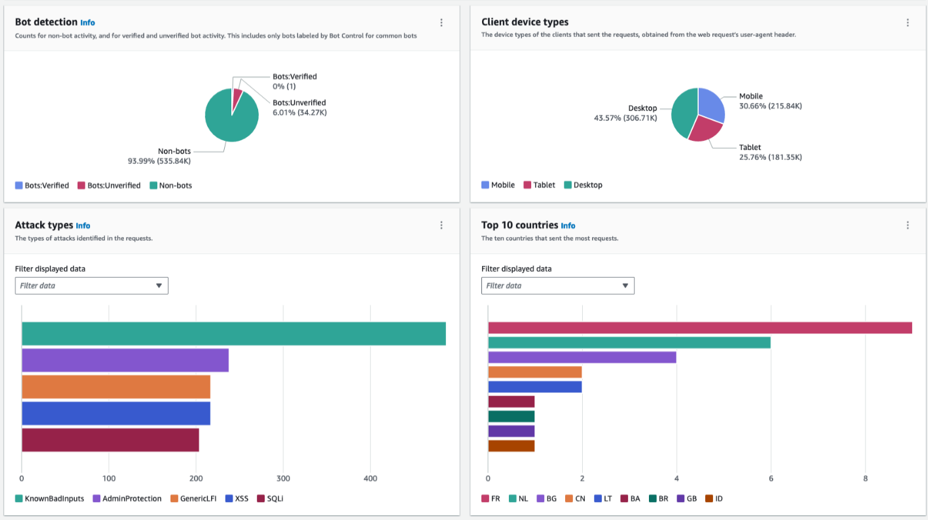
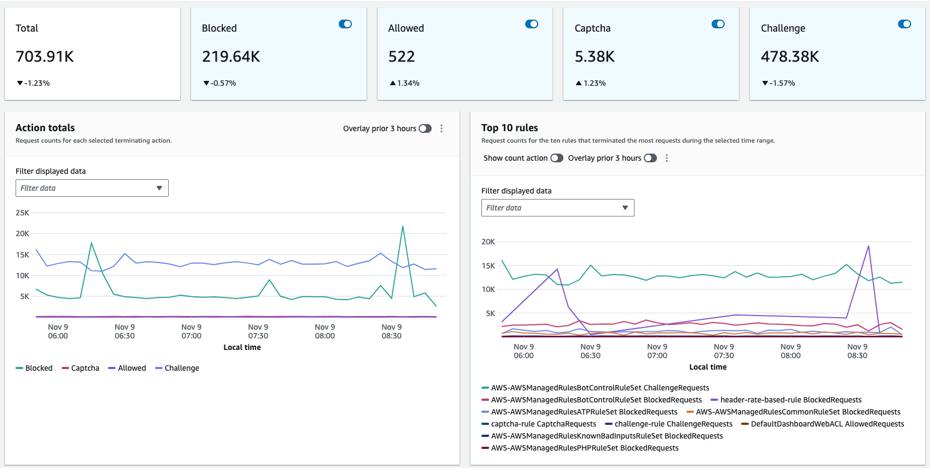
- Real-time Metrics: The dashboard provides near real-time visibility into CloudWatch metrics collected by AWS WAF. You can view total requests, blocked vs. allowed requests, bot vs. non-bot traffic comparisons, and the top 10 active rules.
- Sampled Requests Tab: The Sampled Requests tool is now separated into its own tab, showing details for 100 requests matching specific rules and 100 requests matching default actions within the last 3 hours.
- Detailed Categorization: It categorizes requests with detailed breakdowns by attack type, device type, and country. For instance, if your application targets desktop users in Vietnam but you see a spike in mobile traffic from France, you can take immediate action to block it.
Use Case 1: Pattern Analysis and System Diagnosis
The dashboard is designed for active threat hunting. Suppose your system normally receives 2,000 requests/minute, but suddenly spikes to 10,000 requests/minute from unexpected device types. This is a clear indicator that requires immediate investigation.
If a specific rule shows a high volume of blocked requests, it indicates a targeted attack vector.
Actions following analysis:
- Refine WAF Rules: Adjust regex matching to minimize false positives or false negatives.
- Automate IP Blocking: Leverage the Amazon IP reputation list to automatically block known malicious IPs.
- Mitigate DDoS: Monitor source IPs and configure rate-based rules to suppress traffic spikes.
Use Case 2: Monitoring and Optimizing Bot Control
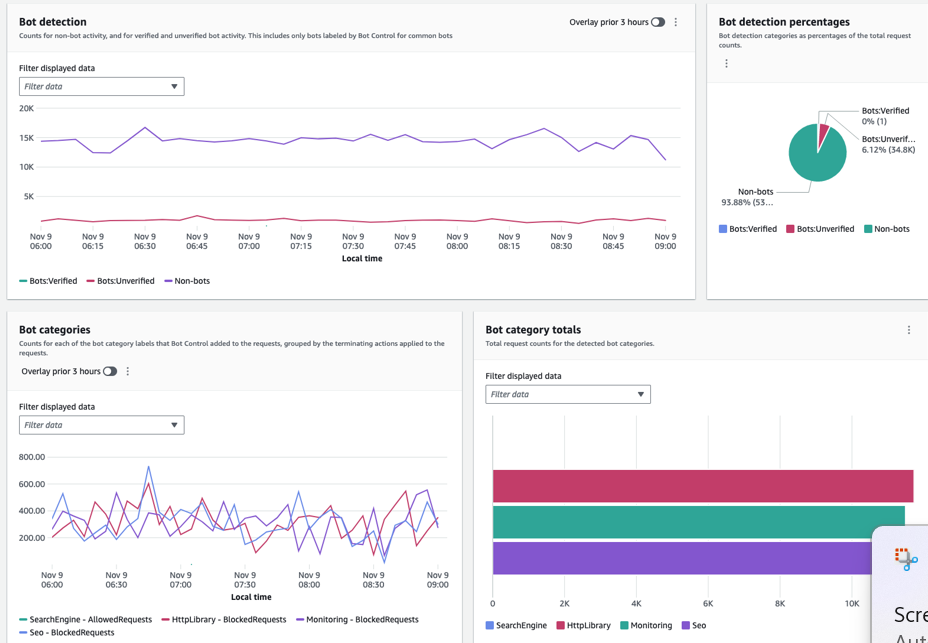
If you use AWS WAF Bot Control, the dashboard clearly displays the percentage of traffic originating from bots (scrapers, scanners, crawlers, etc.).
- Onboarding Phase: Enable Bot Control rule groups in Count mode and use the dashboard to check if legitimate user traffic is being misclassified (to configure rule exceptions).
- Handling Advanced Bots: AWS WAF uses browser fingerprinting, silent challenges, or CAPTCHAs to issue tokens. The Token Status panel on the dashboard helps monitor requests lacking tokens or presenting invalid tokens, allowing you to write custom rules to block or rate-limit these requests.
Quick Comparison: AWS WAF Dashboard vs. CloudFront Security Dashboard
- AWS WAF Traffic Overview Dashboard: Designed for in-depth investigation and traffic pattern analysis to fine-tune detailed security rules.
- CloudFront Security Dashboard: Designed for a unified view of application distribution and baseline security on a single screen without switching consoles.
Summary
The new dashboard eliminates guesswork during traffic analysis. In terms of cost, the dashboard is free; you only pay standard CloudWatch log storage fees if full logging is enabled.
Original Source: Introducing the AWS WAF traffic overview dashboard | AWS Security Blog
Translated Post: AWS Study Group VN | Facebook
Illustrations: